Author
Veritrade’s foreign trade team. Specialists in foreign trade data and international market analysis, focused on real decision-making for importers and exporters.
Summary
Trade between the United States and Latin America is undergoing a period of structural adjustment, shaped by the integration of production chains, country-level specialization, and the reconfiguration of regional trade flows.
Importers and exporters must make decisions today on which markets to prioritize, which products to analyze, which partners to assess, and where real growth opportunities exist.
In this context, analyzing trade flows using reliable data becomes key to reducing risk, sharpening strategic focus, and anticipating competitive moves.
Structure of U.S. Exports to Latin America
U.S. exports to Latin America are characterized by a high share of manufactured goods and medium- to high-technology products. According to Veritrade’s analysis, these flows are mainly driven by regional demand for production inputs and capital goods.
Within the set of leading products analyzed, trade flows are primarily concentrated in:
- Energy and fuels (˜38%)
- Electronics and machinery (˜27%)
- Aerospace and aeronautics (˜15%)
- Agri-food products (˜6%)
- Automotive and auto parts (˜5%)
- Chemicals, pharmaceuticals, and plastics (˜2%)
- Others (˜8%)
These products play a key role in strategic sectors across Latin American economies, such as manufacturing, mining, construction, and energy.
The composition of the export basket indicates that the United States mainly acts as a supplier of intermediate and capital goods, reinforcing its role within regional production chains.
In practice, this means that a significant share of trade is anchored in stable productive relationships, rather than in short-term opportunities.
Main Destinations of U.S. Exports in Latin America
U.S. exports to Latin America show strong geographic concentration, reflecting differences in market size, level of industrialization, and degree of economic integration across countries in the region.
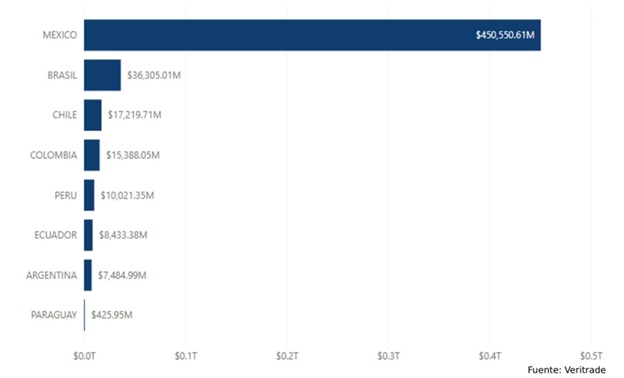
Chart 1
Ranking of destination countries for U.S. exports to LATAM in 2025
Mexico: Deep Productive Integration
Mexico stands out as the main destination for U.S. exports in Latin America, accounting for approximately 73% of the regional total.
This leadership is explained by the strong productive integration between the two countries, especially in the automotive, electronics, and advanced manufacturing sectors.
Exports to Mexico consist mainly of intermediate and capital goods that are part of shared value chains.
This integration makes Mexico a key market for long-term strategies, but also one of the most competitive.
Table 1
Top 5 products exported from the U.S. to Mexico in 2025
| Description | Share |
|---|---|
| Computer parts and accessories for automatic data processing machines (boards, housings, cards, spare parts) (HS Code - 8473300002) | 5.82% |
| Fuel mainly used in transportation; light petroleum derivative (HS Code - 2710121519) | 4.11% |
| Civil aviation goods, including aircraft, engines, specialized equipment, and spare parts (HS Code - 8800000000) | 2.53% |
| Key electronic components for computers and data processing systems (HS Code - 8542310045) | 2.31% |
| Light fuel oil (API = 25°, sulfur = 15 ppm) (HS Code - 2710191106) | 1.99% |
Brazil: Large Market, Lower Integration
Brazil is the second most relevant market (12%), with an export pattern that is less integrated into regional production chains.
Its demand is concentrated in machinery, chemicals, industrial equipment, technology, and high-value goods, linked to the size of its domestic market.
Compared with Mexico, access to the Brazilian market depends more on commercial and regulatory capabilities than on productive integration.
Table 2
Top 5 products exported from the U.S. to Brazil in 2025
| Description | Share |
|---|---|
| Civil aviation goods, including aircraft, engines, specialized equipment, and spare parts (HS Code - 8800000000) | 19.26% |
| Light fuel oils, API = 25°, sulfur = 15 ppm (HS Code - 2710191106) | 6.42% |
| Light crude petroleum oil for refining and energy derivatives (HS Code - 2709002090) | 3.21% |
| Naphthas (excluding motor fuel or blending), no biodiesel (HS Code - 2710122500) | 2.19% |
| Immunological products, packaged in measured doses or for retail sale (HS Code - 3002150100) | 1.95% |
Mid-tier Markets: Colombia, Chile, and Peru
Colombia (4%), Chile (4%), and Peru (2%) form a mid-tier group, with imports centered on industrial goods, production inputs, and technology.
These markets show stable demand linked to mining, energy, infrastructure, and services.
For many companies, these countries represent growth opportunities with lower competitive saturation.
Central America and the Caribbean
Finally, Central American and Caribbean countries represent smaller-volume destinations, but with specific relevance in certain products such as consumer goods, light machinery, and pharmaceuticals. Their participation reflects smaller economies, but with steady trade ties with the United States.
The rest of regional trade is distributed across other smaller markets.
Overall, the comparative analysis shows that U.S. exports to Latin America are shaped by both productive integration and each market’s absorption capacity, resulting in distinct destination profiles across the region.
Structure of U.S. Imports from Latin America
U.S. imports from Latin America have a more diversified structure, combining manufactured goods, primary products, and natural resources.
According to Veritrade’s analysis, these flows are driven by both regional industrial integration and the availability of natural resources in the region.
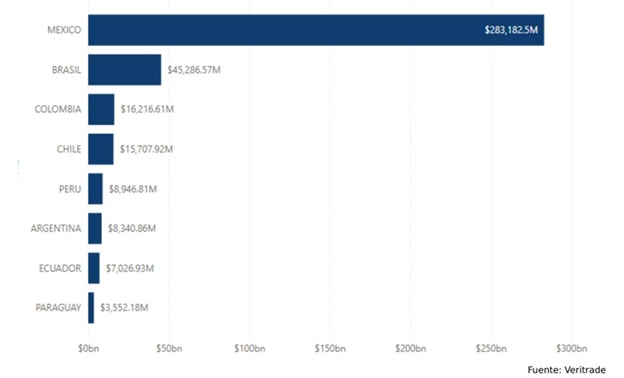
Chart 2
Main LATAM supplier countries to the United States in 2025
Main Supplier Countries from Latin America to the United States
U.S. imports from Latin America differ clearly by supplier country, driven by levels of industrialization, productive specialization, and the degree of integration with the U.S. economy.
Mexico: Integrated Manufacturing
Mexico is the leading supplier to the United States in Latin America (83%), with an export structure dominated by manufactured and industrial goods.
Its competitive advantage lies in cross-border production chain integration, especially in sectors such as automotive, electronics, and machinery.
This relationship generates stable flows, but also a high level of mutual dependence.
Table 3
Top 5 products imported by the U.S. from Mexico in 2025
| Description | Share |
|---|---|
| Digital processing units with integrated storage, input, and output (HS Code - 8471500150) | 14.86% |
| New passenger cars (gasoline), 1,500–3,000 cc, up to 4 cylinders (HS Code - 8703230140) | 3.68% |
| Goods vehicles (spark-ignition), GVW > 2.5 t and = 5 t (HS Code - 8704310140) | 3.21% |
| New passenger cars (spark-ignition), > 1,000 cm³ and = 1,500 cm³ (HS Code - 8703220110) | 2.54% |
| Insulated ignition wiring sets and wiring harnesses for vehicles, aircraft, and vessels (HS Code - 8544300000) | 2.11% |
Brazil: Product Diversification
Brazil ranks as a second-tier relevant supplier (7%), with a more diversified basket combining agro-industrial products, specific industrial goods, and natural resources.
Its participation is significant, though less integrated than Mexico’s in terms of advanced manufacturing.
Table 4
Top 5 products imported by the U.S. from Brazil in 2025
| Description | Share |
|---|---|
| Crude petroleum oils (API = 25°, NESO) (HS Code - 2709002090) | 7.60% |
| Arabica coffee, non-organic, non-decaffeinated, unroasted (HS Code - 0901110025) | 5.38% |
| Semi-finished products of non-alloy steel (< 0.25% C), rectangular section (HS Code - 7207120050) | 3.46% |
| Non-alloy pig iron with phosphorus = 0.5% (HS Code - 7201100000) | 3.38% |
| New civil aircraft with turbofan engine, empty weight 4.5–15 t (HS Code - 8802300140) | 3.23% |
Chile and Peru: Specialization in Natural Resources
Chile (3%) and Peru (2%) stand out mainly as suppliers of minerals and metals—key inputs for U.S. industries such as construction, energy, and technology.
These countries show high specialization in strategic primary products, with a lower share of manufactured goods.
Colombia: Energy and Agroindustry
Colombia (3%) maintains a more balanced offering, with exports concentrated in energy, agro-industrial products, and certain industrial goods. This allows it to sustain a stable presence as a supplier, although with lower volume relative to Mexico and Brazil.
Overall, the comparative analysis shows that while Mexico plays a central role in integrated manufacturing, other Latin American countries specialize in natural resources and primary products—reinforcing the productive complementarity between the United States and the region.
What These Flows Mean for Importers and Exporters
The analysis of trade flows between the United States and Latin America shows that opportunities are not distributed evenly—neither by country nor by sector.
Identifying markets with real activity, understanding which products concentrate flows, and tracking the evolution of main trade partners is key to:
- Prioritizing markets with the highest real potential
- Reducing risk in import and export decisions
- Anticipating competitors’ moves
- Detecting opportunities before entering or expanding
In a context of structural adjustment in regional trade, basing decisions only on aggregated volume or partial information can lead to strategic mistakes.
Analyze These Flows with Verified Data
Access the Veritrade platform and explore real trade flows between the United States and Latin America by country, product, and company.
Start your free trial here