USMCA Agreement: Automotive market trends in the U.S.
Published on 30 April 2026Automotive supply in the U.S.: what the data shows in the context of the USMCA review
Published April 29, 2026
Author
Veritrade's international trade team. Specialists in trade data and global market analysis, focused on understanding how trade flows evolve and what that means for decision-making by importers and exporters.
Summary
The upcoming review of the USMCA in 2026 introduces a new scenario for the automotive sector in North America, one of the most sensitive industries to changes in rules of origin, production, and sourcing.
Beyond the agreement itself, the real impact is reflected in how the market evolves: which countries are supplying the United States, how supplier shares are shifting, and what recent data reveals in terms of volume and pricing.
In this context, analyzing automotive imports using verified customs data makes it possible to identify structural changes in the market, understand the position of countries such as Mexico, Canada, or South Korea, and anticipate potential shifts in competition and demand.
For companies operating in international trade, this type of analysis is key to assessing risks, identifying opportunities, and making better-informed decisions in an increasingly competitive environment.
The context of the USMCA agreement (United States–Mexico–Canada Agreement)
The USMCA review, scheduled for July 1 this year, once again puts the structure of North American trade under scrutiny, particularly in sensitive sectors such as automotive. The agreement includes a joint review six years after its entry into force, and the automotive sector is one of the most relevant due to its rules of origin and regional content requirements.
For companies involved in international trade, the key question is not only what may change in the agreement, but how the market is already evolving: which countries are supplying the United States, which are gaining or losing share, and what signals import data is providing.
In this analysis, we review U.S. automotive imports since 2023, focusing on Mexico, Canada, and South Korea, to understand how competition is evolving in one of the most sensitive sectors under the USMCA.
Why the automotive sector is key in the USMCA review
The automotive sector is one of the core pillars of the USMCA because it relies on highly integrated supply chains between Mexico, the United States, and Canada.
In addition, the agreement introduced stricter rules of origin for vehicles and auto parts to qualify for preferential treatment. Among them, a key requirement is that 75% of automotive content must be produced within North America.
This makes the automotive sector a strong starting point for analyzing the commercial impact of the USMCA. If the agreement's conditions change, sourcing, production, and competitive dynamics may be directly affected.
However, understanding that impact requires more than reviewing the agreement itself. It also requires analyzing how trade flows are currently evolving.
The U.S. market: who supplies its automotive imports
To assess the potential impact of the USMCA review, the most effective approach is to analyze how the United States sources automotive products.
For this analysis, a representative group of customs tariff codes was selected, covering both vehicles and key components within the automotive supply chain, based on data available from February 2023 to December 2025:
| Tariff Code | Description |
|---|---|
| 8703230140 | Passenger vehicles with internal combustion engines (1500–3000 cc) |
| 8703220110 | Passenger vehicles with internal combustion engines (1000–1500 cc) |
| 8704310140 | Vehicles for goods transport |
| 8701210015 | Road tractors for semi-trailers |
| 8703800060 | Electric passenger vehicles |
| 8708295160 | Body parts and accessories |
| 8544300000 | Vehicle wiring sets |
*Source: Veritrade
Within this group of products, Mexico emerges as the leading supplier to the United States, accounting for approximately 47.6% of total imports.
It is followed by other relevant countries such as Canada, South Korea, and Japan, showing that while Mexico dominates the market, competition is not exclusively regional.
Share of automotive imports by country in the U.S.
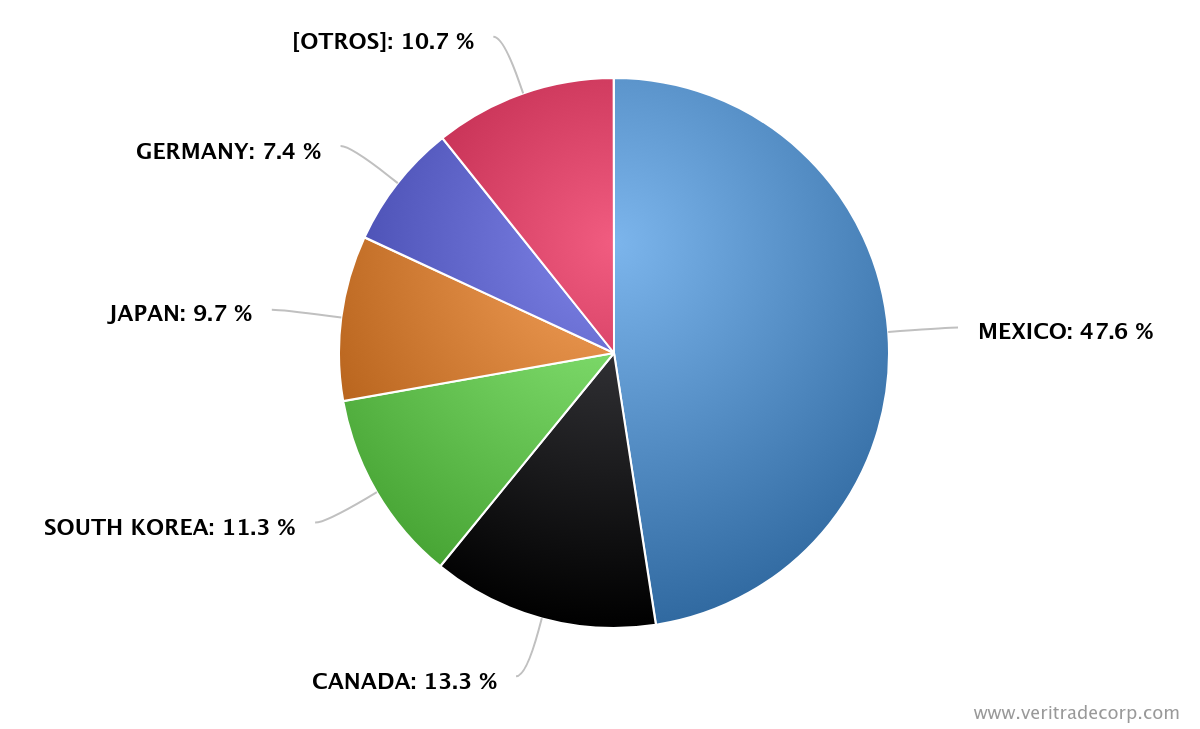
Chart conclusion: Mexico accounts for nearly half of the automotive supply analyzed in the U.S. This confirms its strategic role within the regional USMCA supply chain, while also highlighting the continued importance of global suppliers.
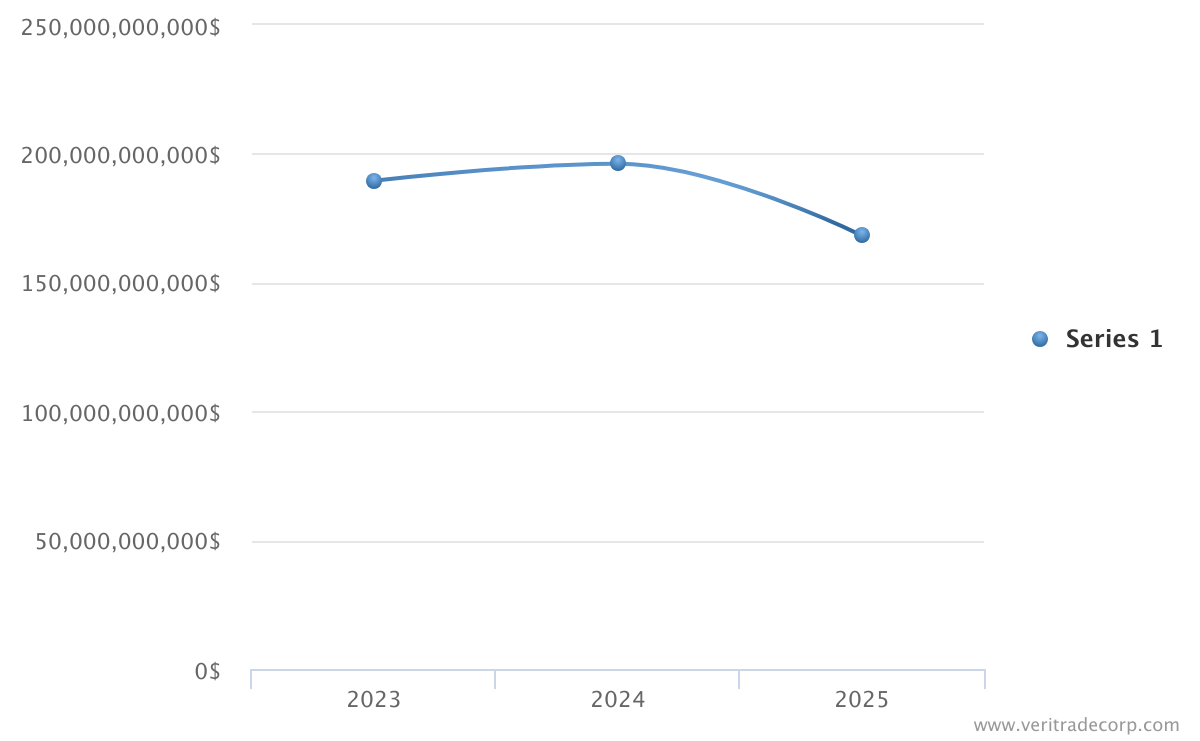
Evolution of automotive imports: growth until 2024 and adjustment in 2025
The time-based analysis reveals a clear pattern. U.S. automotive imports within the selected product group grew until 2024 but show an adjustment in 2025.
This behavior is important because it avoids an overly simplistic interpretation of the market. Mexico leads, but the market is not growing in a linear way. There are signs of adjustment in both import value and average pricing.
Total automotive imports in the U.S. 2023–2026
*Source: Veritrade
Chart conclusion: The market peaks in 2024 and corrects in 2025, suggesting a more competitive environment where supplier stability becomes key in a context of lower growth.
Mexico: clear leadership, but recent adjustment
Mexico is the leading automotive supplier to the United States within the analyzed product group.
Evolution of automotive imports from Mexico:
| Year | Import value from Mexico (US$ CIF) |
|---|---|
| 2023 | 86,249,998,000 |
| 2024 | 92,934,949,307 |
| 2025 | 84,198,367,277 |
*Source: Veritrade
Mexico grows in 2024, reaching its highest point in the analyzed period, and then shows a decline in 2025.
Conclusion: Mexico is not only the leading supplier; it also best reflects the integrated production structure of the USMCA in the automotive sector. However, the decline in 2025 highlights the importance of comparing its evolution with other suppliers.
Canada: a gradual loss of share within the regional bloc
Canada is also part of the USMCA, but its trajectory differs from Mexico's.
Evolution of automotive imports from Canada:
| Year | Import value from Canada (US$ CIF) |
|---|---|
| 2023 | 27,827,380,048 |
| 2024 | 24,692,017,260 |
| 2025 | 22,099,414,877 |
*Source: Veritrade
Unlike Mexico, Canada shows a steady decline from 2023 to 2025, suggesting a loss of relative importance within U.S. automotive supply.
Conclusion: Within North America, Mexico holds a significantly stronger position than Canada. While the agreement favors regional trade, not all countries within the bloc evolve in the same way.
South Korea: active global competition, but more volatile
South Korea reflects global competition outside the USMCA.
Evolution of automotive imports from South Korea:
| Year | Import value from South Korea (US$ CIF) |
|---|---|
| 2023 | 19,820,719,092 |
| 2024 | 23,845,747,070 |
| 2025 | 18,457,317,869 |
*Source: Veritrade
South Korea grows significantly in 2024 and then adjusts in 2025, reinforcing the idea of active but less stable competition compared to Mexico.
Conclusion: South Korea does not displace Mexico's leadership, but it confirms that the U.S. market remains competitive and globally integrated.
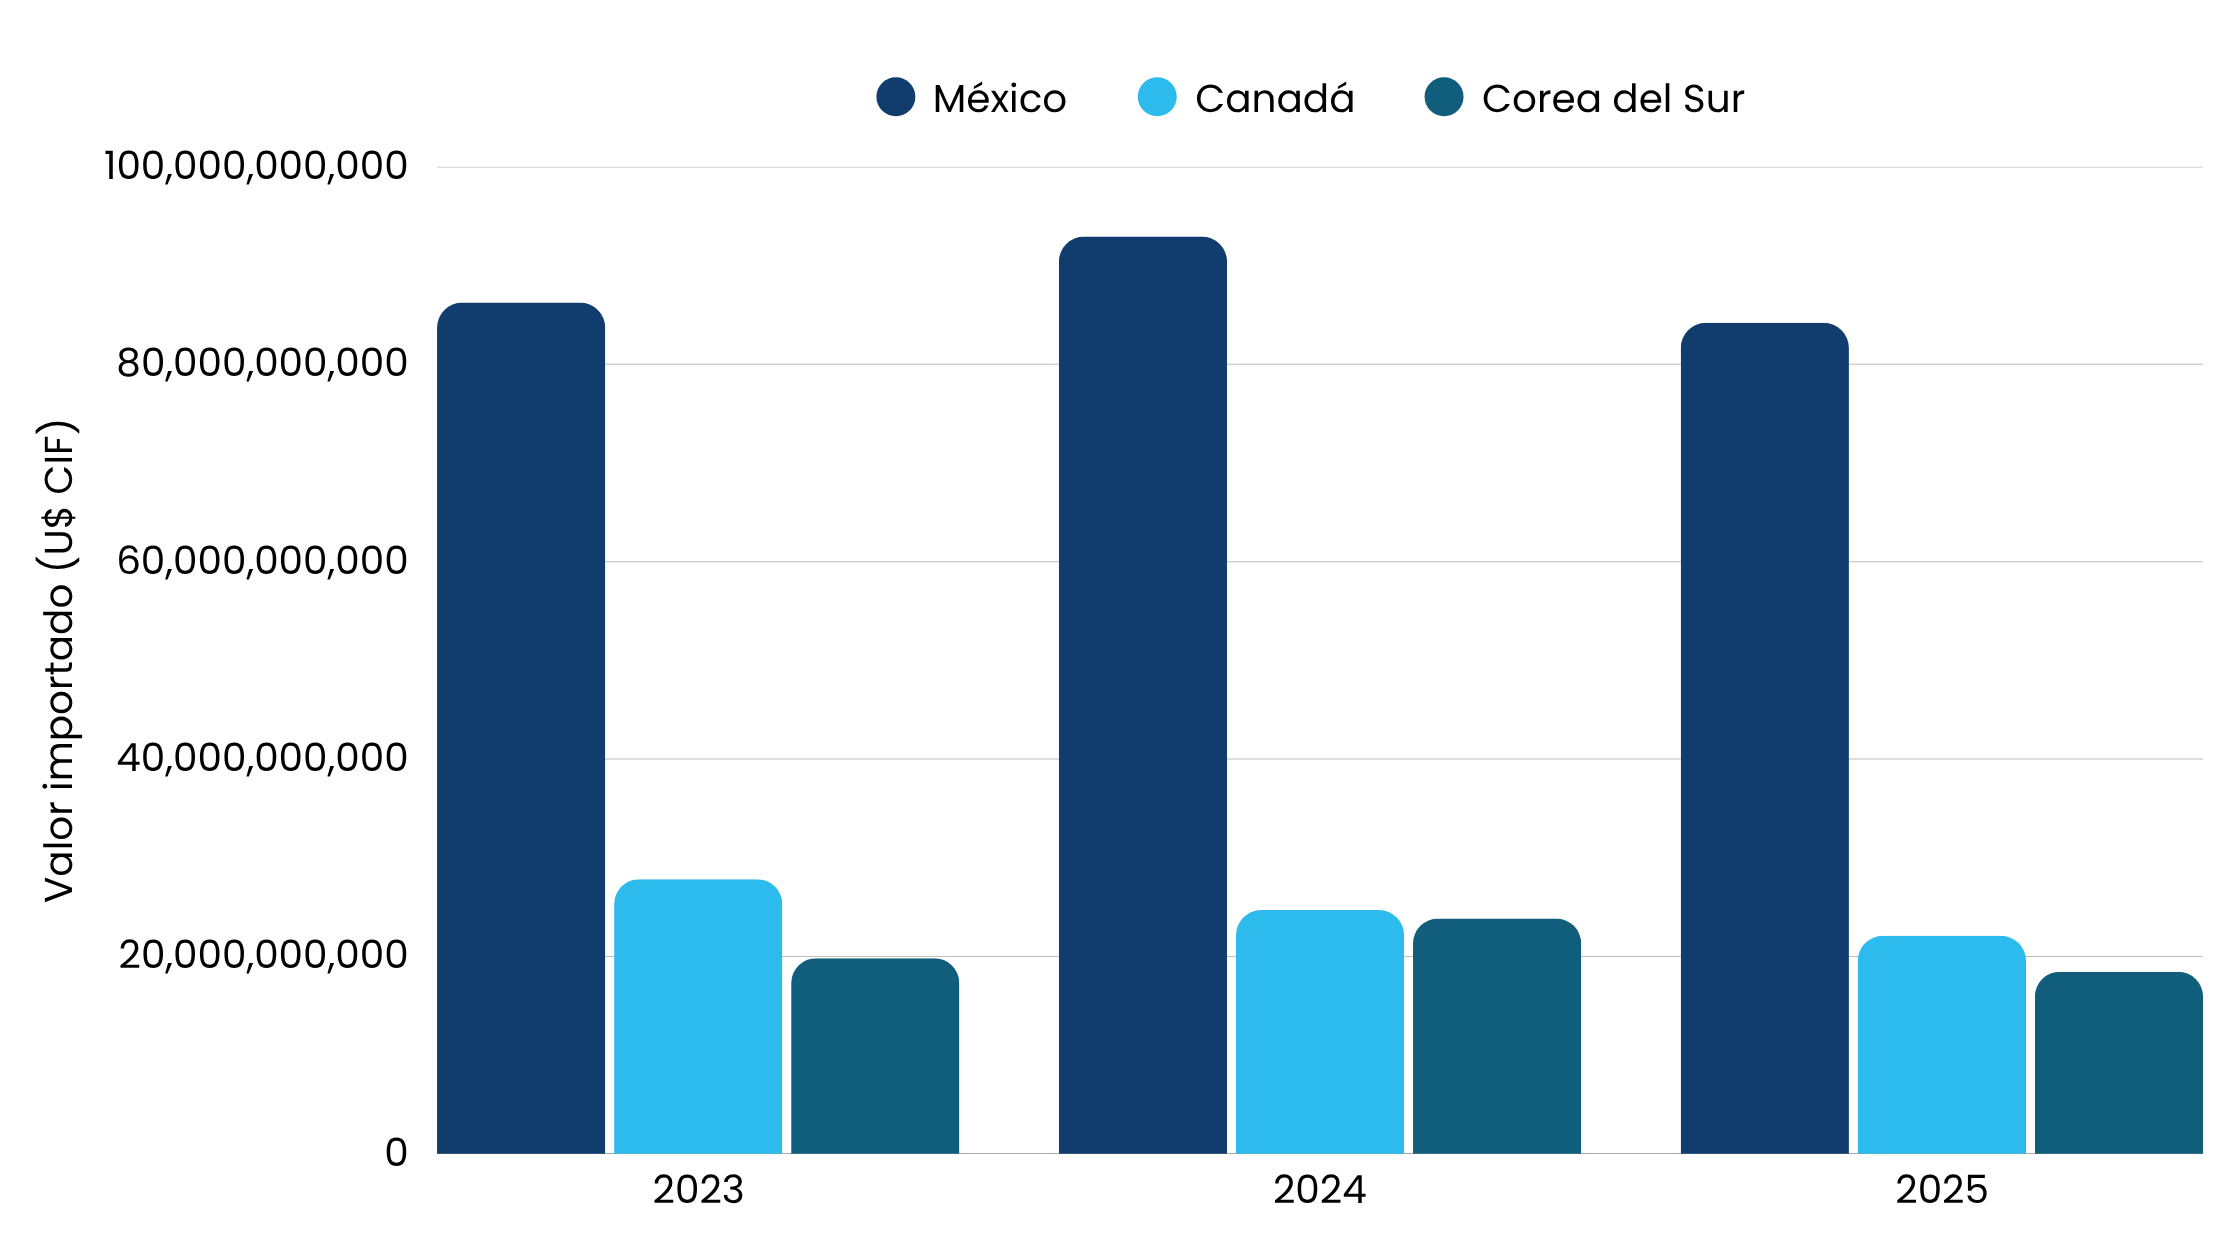
Comparison: Mexico, Canada, and South Korea
Comparing these three suppliers provides a clearer view of market structure.
| Year | Mexico (US$ CIF) | Canada (US$ CIF) | South Korea (US$ CIF) |
|---|---|---|---|
| 2023 | 86,249,998,000 | 27,827,380,048 | 19,820,719,092 |
| 2024 | 92,934,949,307 | 24,692,017,260 | 23,845,747,070 |
| 2025 | 84,198,367,277 | 22,099,414,877 | 18,457,317,869 |
*Source: Veritrade
Country-by-Country Comparison 2023–2025
*Source: Veritrade
Conclusion: Mexico maintains a clear lead. Canada declines steadily, while South Korea shows growth in 2024 followed by a correction, confirming a more volatile competitive presence.
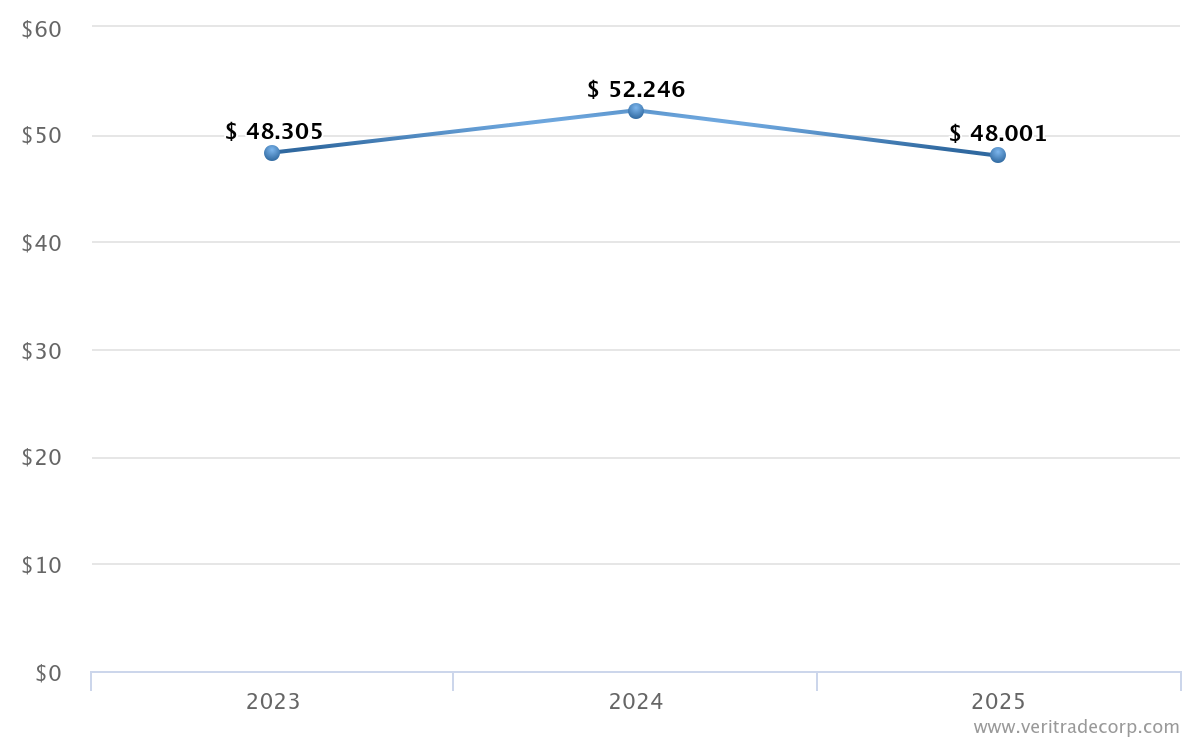
Average price: signs of increasing competitive pressure
Beyond import value, average price also provides relevant insights.
Data shows that average prices peak in 2024 and decline afterward. This may reflect changes in product mix, increased competition, demand adjustments, or shifts in supplier structure.
Average price evolution
*Source: Veritrade
This data should not be interpreted in isolation, although it does indicate that the U.S. automotive market is evolving not only in terms of volume, but also in its underlying commercial conditions.
Conclusion: The decline in average prices after 2024 points to a more competitive environment, where companies need to consider not only volume but also pricing dynamics.
What this analysis means for companies
The value of this analysis lies not only in confirming Mexico's leadership, but in understanding how the market is evolving.
Which countries are gaining or losing share?
Mexico maintains its leadership and accounts for nearly half of the automotive supply analyzed into the United States. Canada shows a steady decline, while South Korea presents a more volatile trend, with significant growth in 2024 followed by a decline.
How is demand evolving in the U.S.?
The market grows through 2024 and shows an adjustment in 2025. This indicates that demand is not expanding in a linear way and that companies need to rely on up-to-date data before making sourcing, expansion, or competitive decisions.
Which markets offer greater stability?
Mexico stands out as the most stable and dominant supplier within the analyzed period. Canada shows a loss of relevance, while South Korea confirms that global competition remains active, although with higher volatility.
What this means in the context of the USMCA review
The USMCA review should not be analyzed solely as a regulatory process. For companies, the real impact lies in how it may reshape the structure of the market.
In the automotive sector, the analysis highlights three key points:
- Mexico remains the dominant supplier to the United States.
- Canada is losing relative weight within the regional bloc.
- Global competition, particularly from Asia, remains relevant.
To analyze these changes in depth and understand how demand is evolving in the U.S., it is essential to identify which companies are behind these movements, which importers concentrate demand, and which exporters are gaining presence.
This level of analysis would make it possible to understand how trade relationships are being reconfigured and to anticipate shifts within the market.
Access importer and exporter insights with Veritrade
Understanding which importers concentrate demand in the U.S., which exporters are gaining presence, and how these relationships evolve allows companies to move from a general view to concrete decisions.
With Veritrade, you can access this level of detail and analyze these movements by company, product, country, and time period.
Start your free trial and analyze your market with real data.