Ecuador–United States Trade Agreement: Which Exports Could Gain Market Share
Published on 18 March 2026Author
The Veritrade Foreign Trade Team. Specialists in international trade data and market analysis, focused on enabling real-world decision-making for importers and exporters.
Summary
Progress toward a trade agreement between Ecuador and the United States introduces a potential shift in market access conditions for key products such as shrimp, bananas, cocoa, and flowers.
In a scenario where tariffs are reduced or eliminated, exporting and importing companies will need to assess how supplier competitiveness may evolve, which countries could gain or lose market share, and which products are most exposed to these changes.
Analyzing international trade data provides valuable insights into current trade flow structures, helps anticipate competitive shifts, and identifies opportunities across global markets.
What Changes with the Ecuador–United States Trade Agreement
The progress of the IDEA Act (United States–Ecuador Partnership Act) opens the door to potential tariff reductions or eliminations for certain Ecuadorian products in the U.S. market.
Beyond the political context, the real impact is commercial: improved tariff conditions can shift relative competitiveness between countries and reshape sourcing structures in the United States.
In this scenario, the key question is not only what Ecuador exports, but which products carry the most weight and which countries it is currently competing against.
Current Structure of Ecuador's Exports to the United States
Ecuador's exports to the United States are heavily concentrated in agro-industrial products, with certain sectors clearly dominating in terms of FOB value.
| PRODUCTS | SHIPMENTS | TOTAL US$ FOB | % SHARE | TOTAL KG | US$/KG |
|---|---|---|---|---|---|
| 0803901110 Certified organic. Fresh bananas for export only, 208-box (31 lb) | 12,948 | 3,443,950,507 | 18.88% | 370,200,519 | 9.303 |
| 0306171900 Other shrimp, prawns, and other Natantia decapods: | 22,025 | 2,854,565,543 | 15.65% | 258,334,491 | 11.050 |
| 0603110000 Roses | 34,408 | 1,973,928,809 | 10.82% | 88,470,687 | 22.312 |
| 0803901190 Fresh bananas for export only, 208-box (31 lb) | 9,774 | 1,607,233,436 | 8.81% | 450,467,147 | 3.568 |
| 1801001990 Other cocoa beans, whole or broken, raw or roasted | 2,394 | 1,165,912,800 | 6.39% | 145,181,419 | 8.031 |
Source: Veritrade
Among the top exported products, the following stand out:
- Bananas (organic and conventional): over 27% of total export value combined
- Shrimp: 15.65%
- Roses: 10.82%
- Cocoa beans: 6.39%
These four sectors account for a significant share of bilateral trade, positioning them as the main candidates to benefit from improved tariff conditions.
The export structure shows that Ecuador concentrates its shipments in a limited number of products where it already holds a strong position in the U.S. market.
Which Ecuadorian Products Could Benefit the Most from Zero Tariffs
By cross-referencing Ecuador's top export products with those that carry the greatest weight in U.S. imports, four particularly relevant categories emerge:
| PRODUCTS | SHIPMENTS | TOTAL US$ CIF | % SHARE |
|---|---|---|---|
| 1801000000 Cocoa beans, whole or broken, raw or roasted | 78 | 1,026,742,955 | 9.60% |
| 0306170041 Farmed shrimps and prawns, frozen, peeled, imported in accordance with Statistical Note 1 | 278 | 897,391,331 | 8.39% |
| 0603110050 Roses, fresh cut, suitable for bouquets or ornamental purposes, other than spray roses | 187 | 557,177,311 | 5.21% |
| 0803900035 Bananas, fresh | 128 | 348,324,314 | 3.26% |
| 0803900025 Certified organic bananas | 147 | 298,460,296 | 2.79% |
Source: Veritrade
Among these categories:
- Cocoa: 9.60% of the analyzed imports
- Shrimp: 8.39%
- Roses: 5.21%
- Bananas (including organic): relevant presence across multiple tariff lines
This positions them as the main candidates to gain competitiveness under a zero-tariff scenario.
International Competition: Who Currently Supplies the United States
The real impact of the agreement depends not only on Ecuador, but also on the countries it competes with in each market.
Cocoa
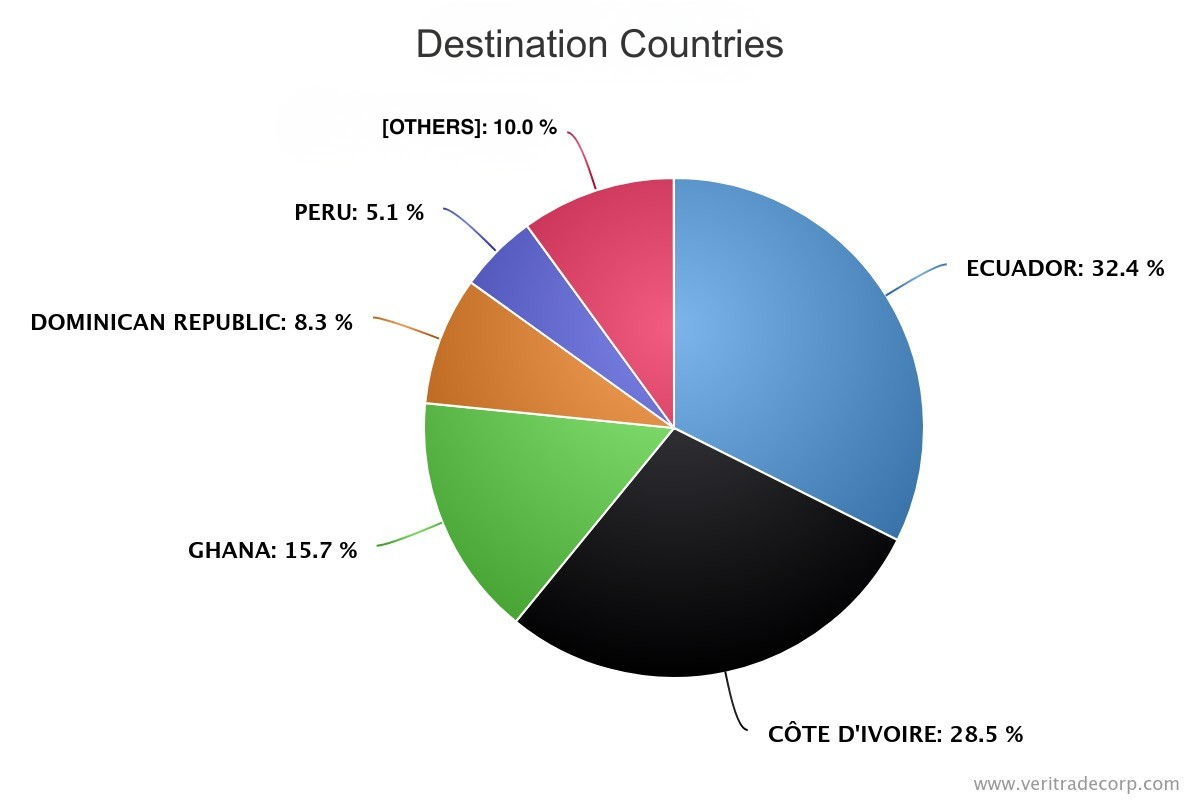
- Ecuador: 32.37%
- Côte d'Ivoire: 28.53%
- Ghana: 15.71%
Ecuador is already the leading supplier but competes with major African producers. Improved tariff conditions could further strengthen its leadership.
Shrimp
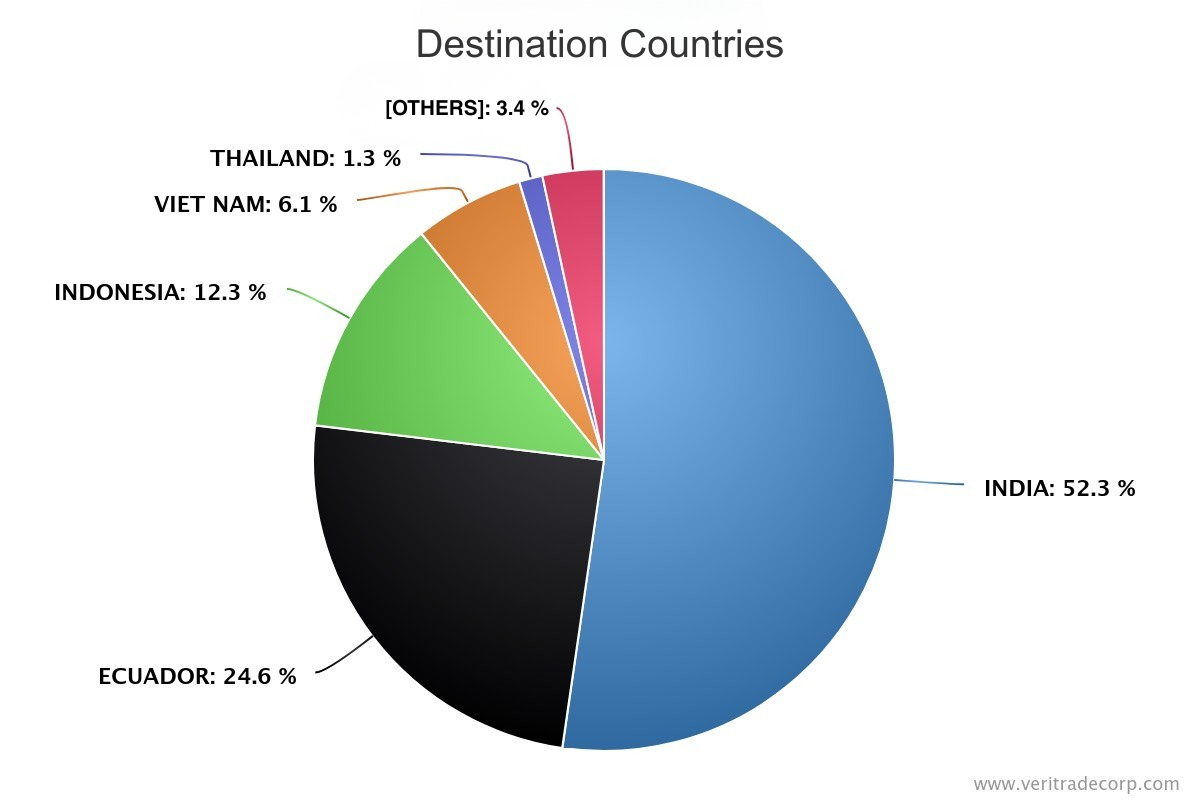
- India: 52.34%
- Ecuador: 24.62%
- Indonesia: 12.28%
India dominates this market. Ecuador ranks second, with room to grow if its relative competitiveness improves.
Roses
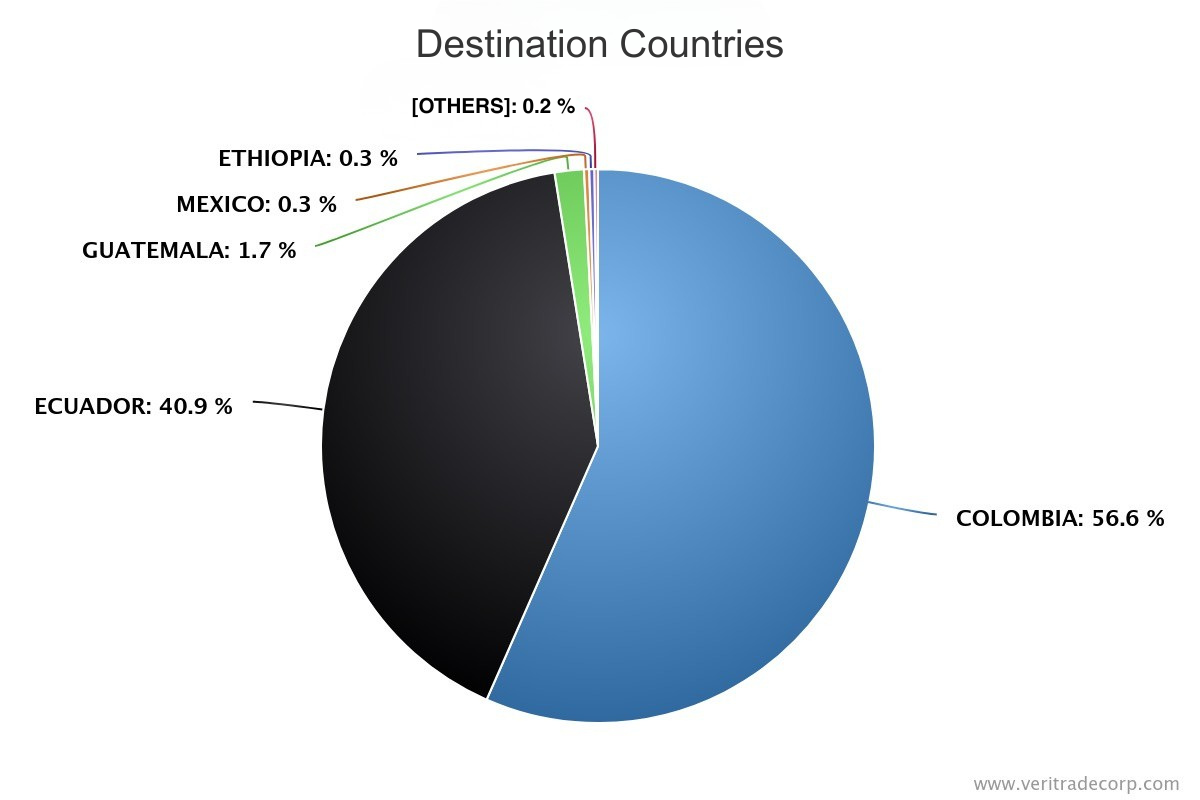
- Colombia: 56.64%
- Ecuador: 40.93%
A highly concentrated market where Ecuador already holds a strong position against a single major competitor.
Fresh Bananas
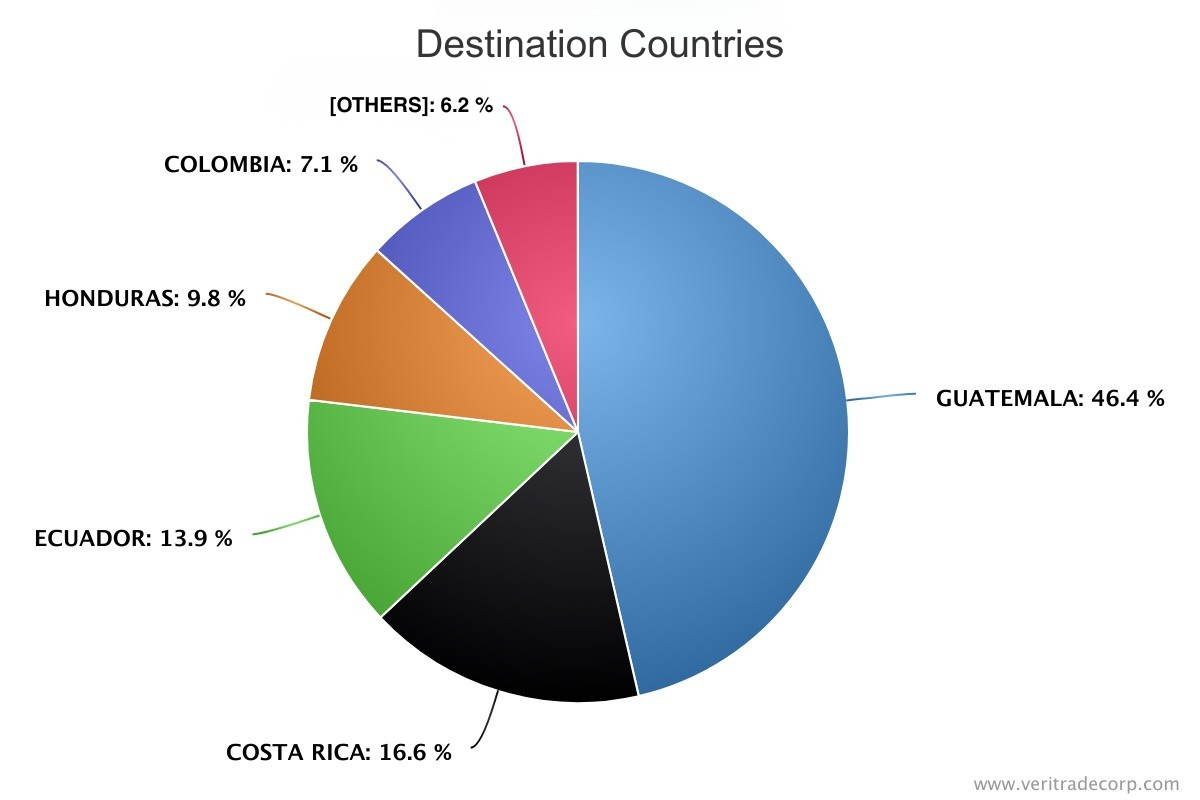
- Guatemala: 46.43%
- Costa Rica: 16.63%
- Ecuador: 13.92%
In conventional bananas, Ecuador competes in a more fragmented market.
Organic Bananas
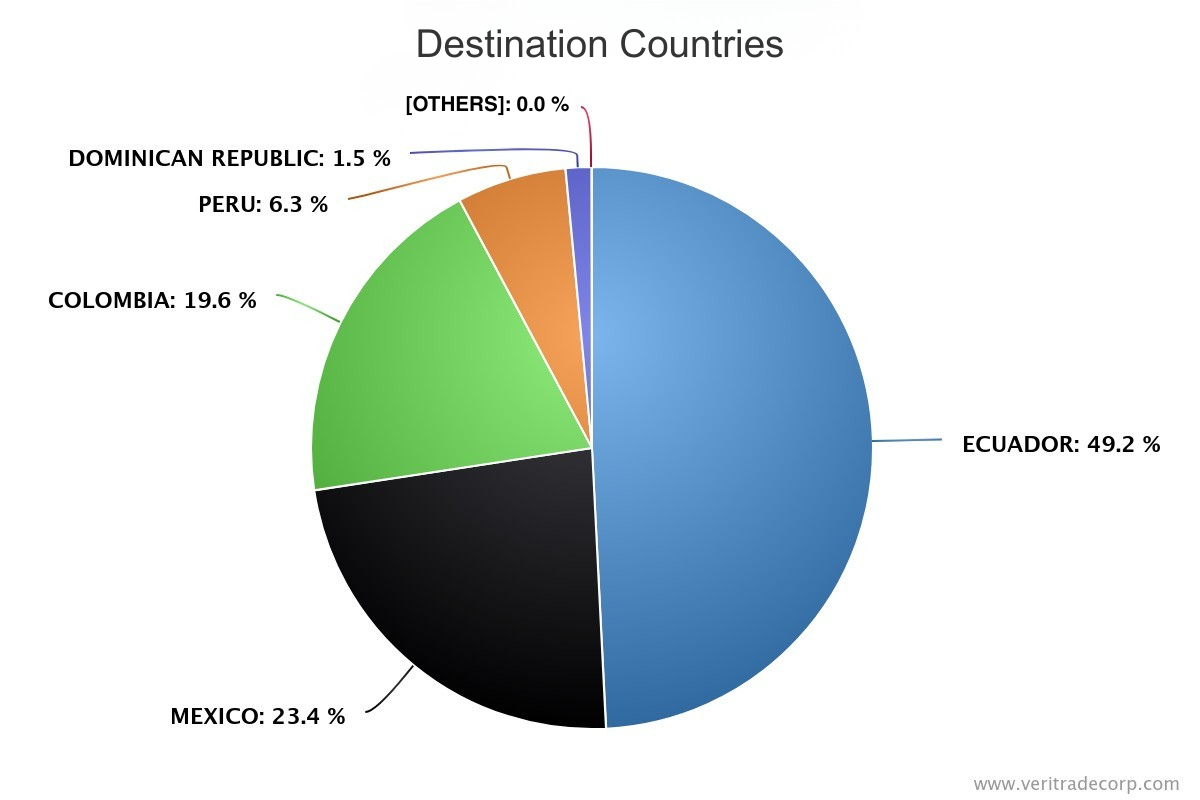
- Ecuador: 49.18%
- México: 23.41%
- Colombia: 19.58%
In this segment, Ecuador already clearly dominates the market.
Which Countries Could Lose Market Share in the U.S. Market Under the Agreement
If Ecuador improves its tariff position, the impact would directly affect its current competitors in the U.S. market.
The clearest scenarios include:
- Shrimp: increased competitive pressure on India, Indonesia, and Vietnam
- Roses: stronger direct competition with Colombia
- Bananas: potential market share redistribution affecting Guatemala, Costa Rica, and Colombia
- Cocoa: reinforcement of Ecuador's position against Côte d'Ivoire and Ghana
The impact would not be uniform. It will depend on factors such as:
- the ability to compete on price per kilogram
- production capacity
- consistency and reliability of supply
- and existing trade relationships
However, the overall direction is clear: improved tariff conditions tend to shift market share toward the country that benefits—especially when it already has a strong presence in the market.
Analyze These Changes with Real Data to Identify Opportunities in International Trade
If your company operates in international trade, anticipating changes in supply structures and competitive dynamics is key to making more informed decisions.
With Veritrade, you can analyze in real time:
- which products concentrate the highest trade volumes
- which countries are gaining or losing market share
- how prices and volumes evolve across markets
- which companies are active in each trade flow
Access the platform and explore how these changes can impact your market. Start your free trial here.