El Niño Costero in Peru and Its Potential Impact on Mango, Blueberry and Avocado Exports
Published on 04 March 2026Author
Veritrade’s foreign trade team. Specialists in foreign trade data and international market analysis, focused on real decision-making for importers and exporters.
Summary
The El Niño Costero phenomenon in Peru introduces a new layer of climate uncertainty that could affect agricultural production and alter international trade flows for key products such as mango, blueberries, and avocados.
Importers and exporters should assess their level of dependency on specific origins, the supply structure in their main markets, and which alternative suppliers could potentially absorb part of the demand.
In this context, analyzing trade flows with up-to-date data becomes essential to anticipate shifts in global supply and make more informed strategic decisions.
The Impact of the El Niño Costero Phenomenon on Peru’s Agro-Export Sector
The El Niño Costero phenomenon is currently active off the Peruvian coast, with anomalous increases in sea surface temperatures that could intensify in the coming weeks. Historically, this phenomenon has been associated with extreme rainfall, logistical disruptions and production impacts in agricultural regions across the northern and central parts of the country.
From a foreign trade perspective, the relevant analysis is not only climatic but structural: assessing how a potential reduction in supply could affect international trade flows of products where Peru holds a significant position.
Among the products with the highest exposure are:
- Mango
- Blueberry
- Avocado
These three products are part of Peru’s core agro-export portfolio and maintain a consolidated presence in markets such as the United States, the Netherlands, Spain and China.
A potential reduction in production could lead to adjustments in volumes, prices and international trade flows.
Structure of Peruvian Mango, Blueberry and Avocado Exports
Peru’s agricultural exports of mango, blueberry and avocado show a highly concentrated structure by destination market. The cumulative analysis since January 1, 2025 highlights clear patterns of commercial dependency.
Together, these three products show:
- Strong concentration in the United States and Europe
- A significant role of the Netherlands as a logistics hub
- Meaningful differences in average price per kilogram depending on destination
The composition of these flows indicates that Peru plays a structural role within the global fresh fruit supply chain.
In a context of climate-related disruption, this concentration increases exposure for both exporters and importers.
Mango: Concentration in North America and Europe
Peruvian mango exports show a geographically concentrated distribution across a limited number of key markets.
Chart 1
Ranking of destination countries for Peruvian mango (2025)
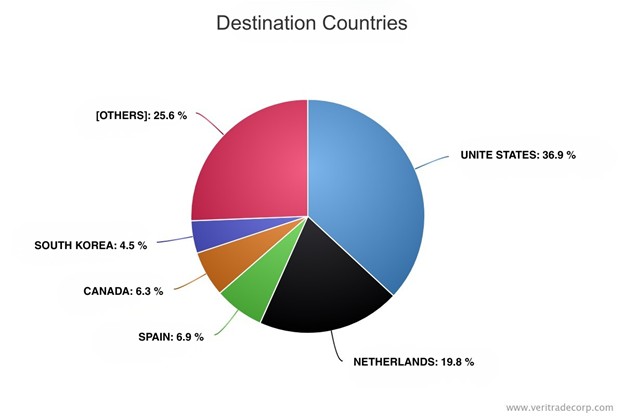
Main destinations by share of FOB value:
- United States: 36.9%
- Netherlands: 19.8%
- Spain: 6.9%
- Canada: 6.3%
- South Korea: 4.5%
The first two markets account for more than 50% of total export value.
This structure implies that any reduction in Peruvian volumes would primarily affect importers in the United States and Western Europe.
Blueberry: High Dependence on the U.S. Market
Blueberry exports show an even higher concentration.
Chart 2
Ranking of destination countries for Peruvian blueberries (2025)
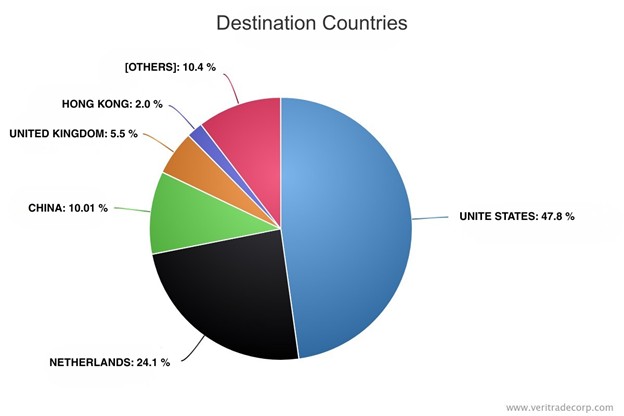
Main destinations:
- United States: 47.8%
- Netherlands: 24.1%
- China: 10.2%
- United Kingdom: 5.5%
- Hong Kong: 2.0%
More than 70% of Peruvian blueberry FOB value is concentrated in the United States and the Netherlands.
This structure reveals high exposure of the U.S. market to potential supply restrictions.
Avocado: A More Fragmented Structure
Avocado exports display a more diversified distribution compared to mango and blueberry.
Chart 3
Ranking of destination countries for Peruvian avocado (2025)
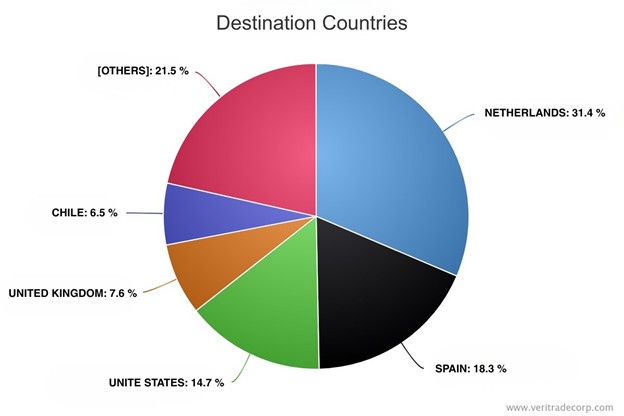
Main destinations:
- Netherlands: 31.37%
- Spain: 18.32%
- United States: 14.72%
- United Kingdom: 7.60%
- Chile: 6.51%
Unlike blueberries, avocado exports are more fragmented by destination, although Europe remains a key region.
There are also relevant differences in US$/Kg depending on the country, suggesting segmentation by quality, seasonality or distribution channel.
Substitution Scenario: Supply Structure in Key Markets
The capacity to absorb a potential reduction in Peruvian supply depends on the current supplier structure in major destination markets.
Mango – United States
Peru (17.6%), China (16.3%) and Thailand (11.2%) account for the largest shares.
The structure is relatively diversified, suggesting that China and Thailand could increase their relative participation if Peruvian volumes decline.
Blueberry – United States
Laos accounts for 33.5% of supply, followed by Peru (30.5%) and Chile (16.5%).
Peru’s export volume represents a significant share of the U.S. market. Substitution capacity would primarily rely on Laos and Chile.
Avocado – Netherlands
Peru represents 42.09% of Dutch supply, followed by Colombia (14.70%) and South Africa (9.24%).
The high concentration in Peru indicates significant dependency. Colombia, South Africa or Chile (8.13%) already operate in the market as alternative suppliers.
What This Scenario Means for Importers
In a context of climate uncertainty, analyzing supply structure becomes critical for decision-making.
Importers should evaluate their level of dependency by product and destination market, as well as the percentage share Peru represents in their total sourcing structure.
In mango exports to the United States, greater diversification suggests a potential redistribution toward already positioned suppliers such as China and Thailand.
In blueberries to the United States and avocados to the Netherlands, higher concentration in Peru implies greater structural exposure, where the ability of Laos, Chile or Colombia to absorb additional demand may be more limited in the short term.
Differences in average prices by origin and overlapping production windows will be key variables in assessing the real impact on availability and cost.
Implications for the Supply Chain
From the exporter’s perspective, the activation of El Niño Costero introduces an additional risk factor in markets where Peru’s participation is structurally significant.
In blueberries to the United States and avocados to the Netherlands, high concentration in Peru means that any volume reduction could translate into:
- Temporary loss of market share to already positioned suppliers
- Increased competition to maintain existing contracts
- Downward pressure or renegotiation dynamics in short-term pricing
In mango exports to the United States, where supply is more diversified, competitive risk is higher, as suppliers such as China or Thailand may expand their relative share more rapidly.
In this context, managing production and logistics risk will be key to preserving commercial continuity and positioning in strategic markets.
Analyze These Flows with Verified Data
If your company makes decisions related to foreign trade, international sourcing or market expansion, anticipating changes in supply structure can make the difference between reacting late and acting with strategic advantage.
Access the Veritrade platform and analyze real-time trade flows of mango, blueberry and avocado by country, product and company.
Start your free trial here.