3 tips to analyze your competition with Veritrade
Published on 24 January 2022
In this article, we explain how the platform helps you to analyze your competition, to be one step ahead at the moment of planning your foreign trade business.
The most important element for viability is an understanding of competitiveness, and that implies knowing who is in the market and under what terms they sell their products. Indeed, understanding how we are positioning ourselves in relation to other companies is the key to turning a feasible plan from a project into a reality.
This is a task that can take dozens of hours of work due to the complexity of accessing the appropriate databases or data sources and synthesizing the relevant content. With this, we will be able to have a clear idea of whether it is convenient to start an import business. In addition, it will also help us to get the partners or financiers we need. Without being able to support satisfactory results or provide a stable outlook like that offered by other alternatives, it will be more difficult to get investors or will create an incentive to abandon the project.
Veritrade offers the possibility to simplify this process by accessing 108 databases from 48 countries with just a few clicks. Who is supplying the product? At what price? How much did it sell and how is it doing in this or that market?
In this note, we explain how the platform can help importers answer questions such as those raised in the previous paragraph.
1. Choose the time period for which you want to do the analysis.
This is the first step to take advantage of Veritrade's platform for analysis of the competition and market. After choosing the product or country, you proceed to customize the temporal horizon for which you want to search for data. In this way, you overcome the rigidity of searching for information in specialized reports, which, although they may have a lot of depth, show information for a specific period of time.
One can spend hundreds of dollars on a study of the bakery products market. However, the document is not necessarily going to fit the dates one wants to evaluate: someone looking to check the trend of prices or quantities imported during the month of April will probably only find annualized information or, at best, quarterly or monthly information for a small amount of years.
The following image shows how the interface of the portal allows you to customize your search.
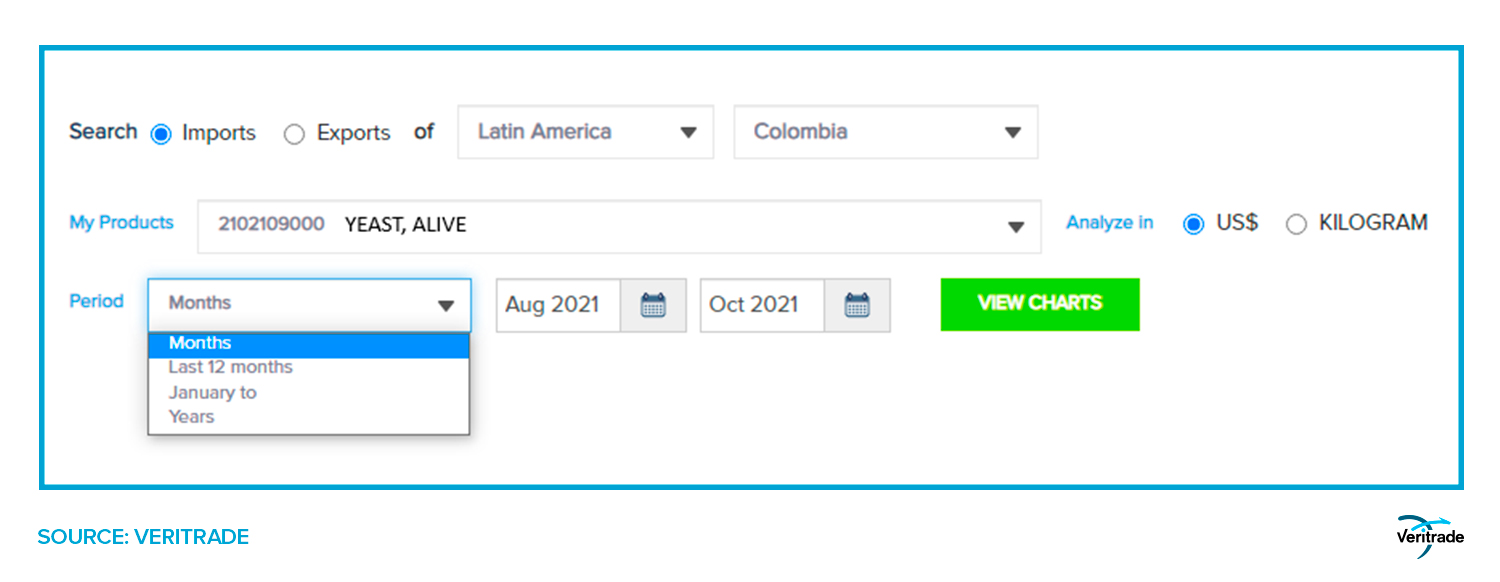
After clicking on search, you obtain information of which companies exports the product, who brings it, and what is the value of each shipment. Additionally, it generates reports on the proportion of shipments generated by each type of means of transport (sea, air or land), as well as the origins or destinations. With this, we have a general idea of the competitors, as well as the prices handled and the quantities moved by each one.
2. Save your competitors as favorites and take advantage of special functions.
As a second step for an optimized search process, we identify the values of the product and who brings it into the country. That information will be visible in the report boxes that the platform automatically displays when you click on search. But as you might expect, some companies are of greater interest than others and you will want to analyze them in greater depth or monitor them constantly.
In general, applying search filters on other information platforms can take a few minutes. To shorten this process, Veritrade offers the possibility to register companies or products as favorites by adding them to the My Products and My Companies sections, so that you have a shortcut ready for the next search. On the other hand, several companies or products can be added to predefined lists. For example, a person interested in cell phones in Chile can create a list with the importers they are looking to track, or another one with the names of the specific products they are interested in.
A conventional search results in a list of 104 importers. To analyze them in a conventional way, it is necessary to download an Excel sheet and choose the ones that are significant. For example, after discarding the 11 manufacturers and telecommunications companies, you are left with a list of 23 independent importers with sales over US $50,000 in the country. In a conventional search, your information will be left loose in the middle of a table of 111 rows in which the most advanced option will be the application of filters. However, after this first search experience, the names of these 23 companies are stored as favorites and cut off path for the next queries.
Below, you can see how the platform has a clean interface that allows you to navigate easily and extract the most relevant information from the group of elements being searched. In this case, the creation of a group of five companies is simulated.
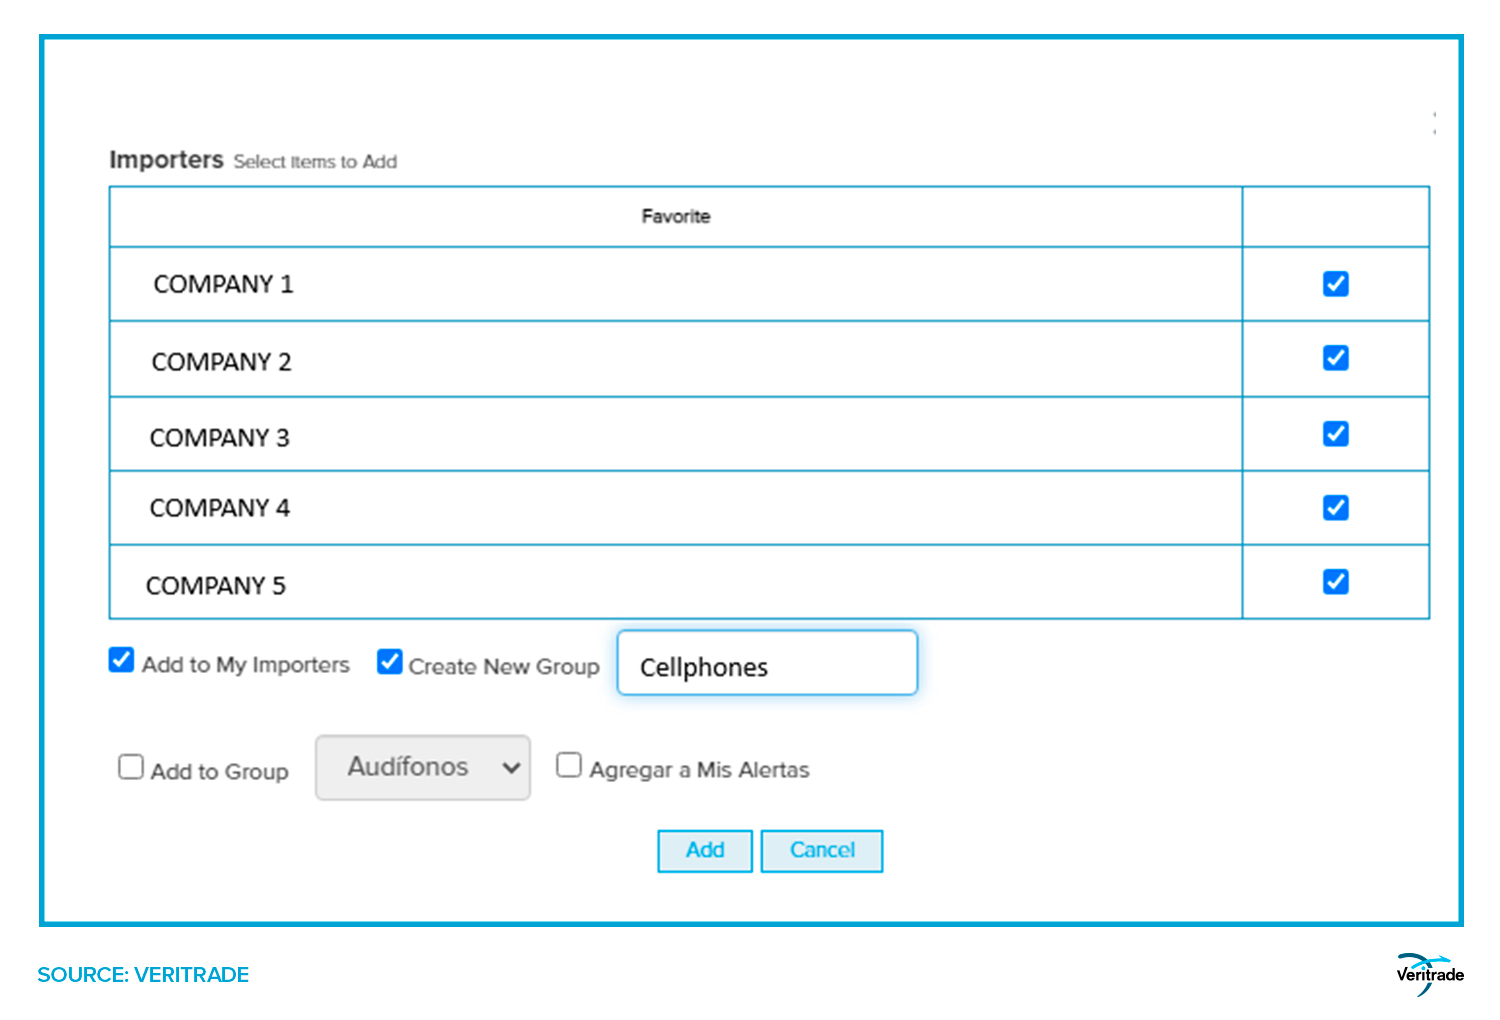
You are now ready to make a specific analysis of the market segment you consider your competition. We advise you to have a predetermined idea of what criteria you will use to choose the group, such as top 10, entry-level brands, origins different to China, etc.
On the other hand, the storage of information in favorites lists also allows the generation of instant graphical reports for an entire sector. This saves time in consolidating data into tables and then processing them into two-axis figures, bars or pies, such as those shown in the next point. Each figure can be downloaded as an image, and you can choose between monetary values or weight, units and volume. It has never been easier to generate useful and impactful information.
3. Track sales and purchases from your suppliers.
The graphs below show an example of what can be achieved with a single click to get an idea about the performance of certain importers. In this case, we simulated a search for a group of wine distributors, whose names were saved in a favorites list titled Wines.
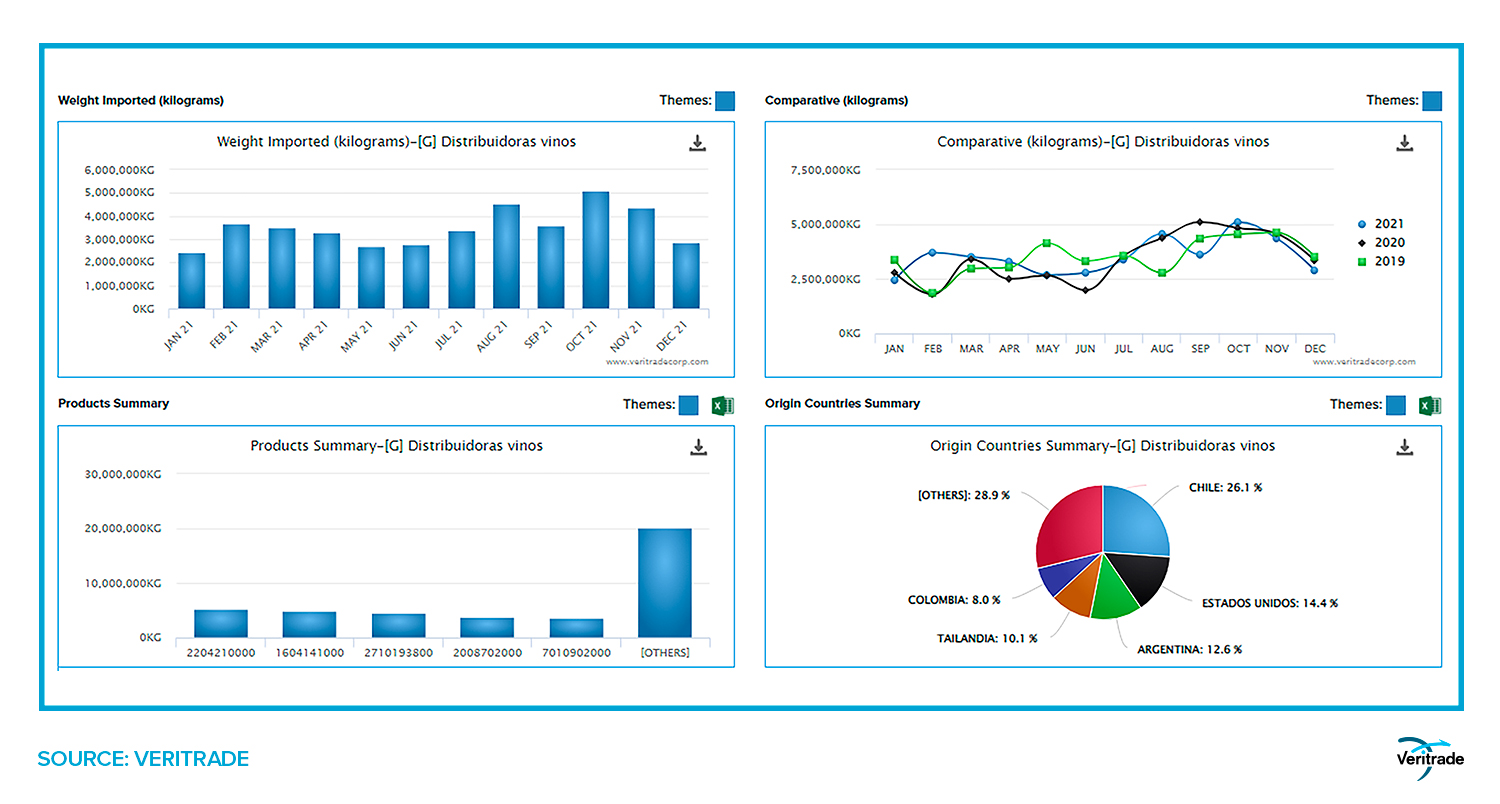
This functionality allows you to get conclusions such as which wine distributors' imports have recovered to pre-pandemic levels, and which items they are importing (this does not only include wines, so it can give you a complete picture of the situation of distributors, which are usually multi-product businesses). For an even more refined search, click on the specific heading (e.g.: 2204210000 - Other wines in containers with capacity less than or equal to two liters) and then download the Excel detail, which gives the specific information of the heading for the selected group of importing companies. The same analysis could be done for heading 220410000 - Sparkling wine), or for any other of the category.
In all cases, the table comes with a pre-configured filter, so you can study the shipments and total movement of each competitor for a specific product in the time horizon you choose. This will allow you to clearly identify who imports more, at higher prices and at what time, to know which company they bought from, from which port they brought it, and even if they paid tariffs.
We recommend you to develop a methodology for your presentations adjusted to the information provided by Veritrade. This way, you will be able to have predetermined schemes that will help you to make the preparation of your reports much faster and focus on the fine-tuning of your presentation.
And at a deeper level, the tables will allow you to cross-reference the importers in the country and the exporters from whom they bought the products. In this way, you can have a clear idea of the suppliers: you will know in which country to find them, at what price they sell, what tariffs are paid for shipments from their country, and even which logistics operators work with the product you are interested in. As an example, you can know that the distributor with the most movements brought 728 of the 2306 shipments of wine of heading 2204210000 to Peru in 2021, but it is only the fifth that brought products with the highest value (6.94%) of the total. In comparison, the one with the highest participation in value brought 620 shipments that totaled 20.1% of the total imported, which suggests that smaller distributors have less capacity to generate inventories or bring products of lower value, a fact that can also be calculated by applying filters in the table and averaging the total value between the number of liters.
These are just some of the features that Veritrade uses to make its users more competitive. Experience it personally by accessing the free trial that we offer through this link. We have abundant information and tools to accompany the process of consolidating your strategy.