The benefits of using Veritrade.
Published on 22 March 2018
Do you know how you and your business or institution can take advantage of Veritrade? Below, we show examples of what an analyst, entrepreneur or academic can achieve using the most complete commercial information search engine in the market.
1. Summary of the most relevant information on the commercial movement
Veritrade allows you to search for exports or imports, and the markets of origin or destination, with a coverage that covers the main Latin American economies, the United States, China, India, and all the countries of the European Union. Once the search has been executed according to the desired filters, Veritrade will show a summary of the main data on the screen. About the tariff item (s) in question, you will have information on values, movement in weight or volume, average price per unit, exporting and importing companies, customs for which the shipment or entry was made from or to the selected country, means of transport used, and if applicable, main markets and specific items for the chosen destination or origin.
Imagine that an Ecuadorian coffee exporter needs to review her competition with her Colombian counterparts. For this purpose, it wants to look for the values of coffee without toasting or decaffeination exported by Colombia throughout 2017. After putting the first search filters (exports - Colombia - Coffee without toasting or decaffeination - January 2017 to December 2017), The system will give the main indicators linked. The image shows the information that will appear on the screen:

2. Analysis of specific aspects
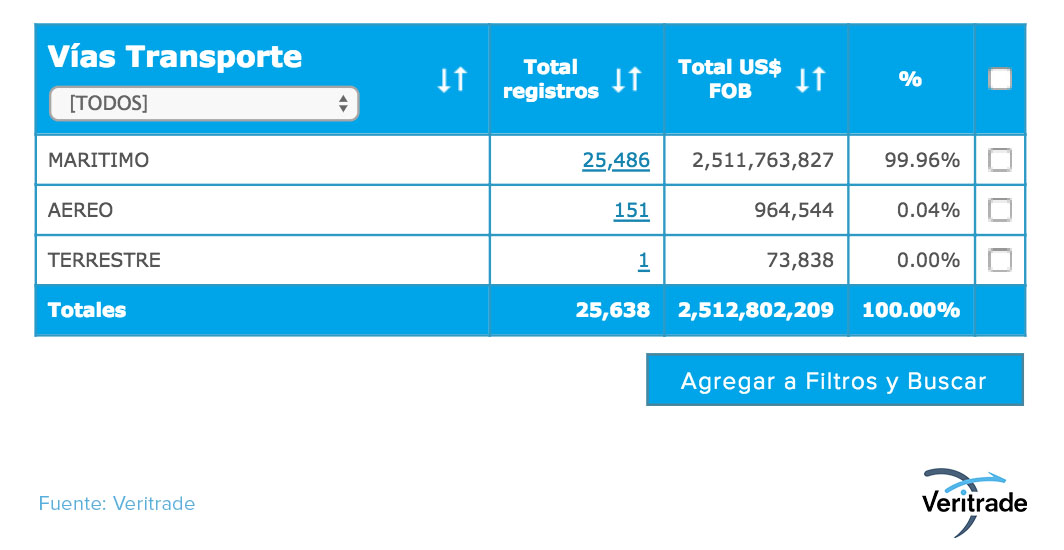
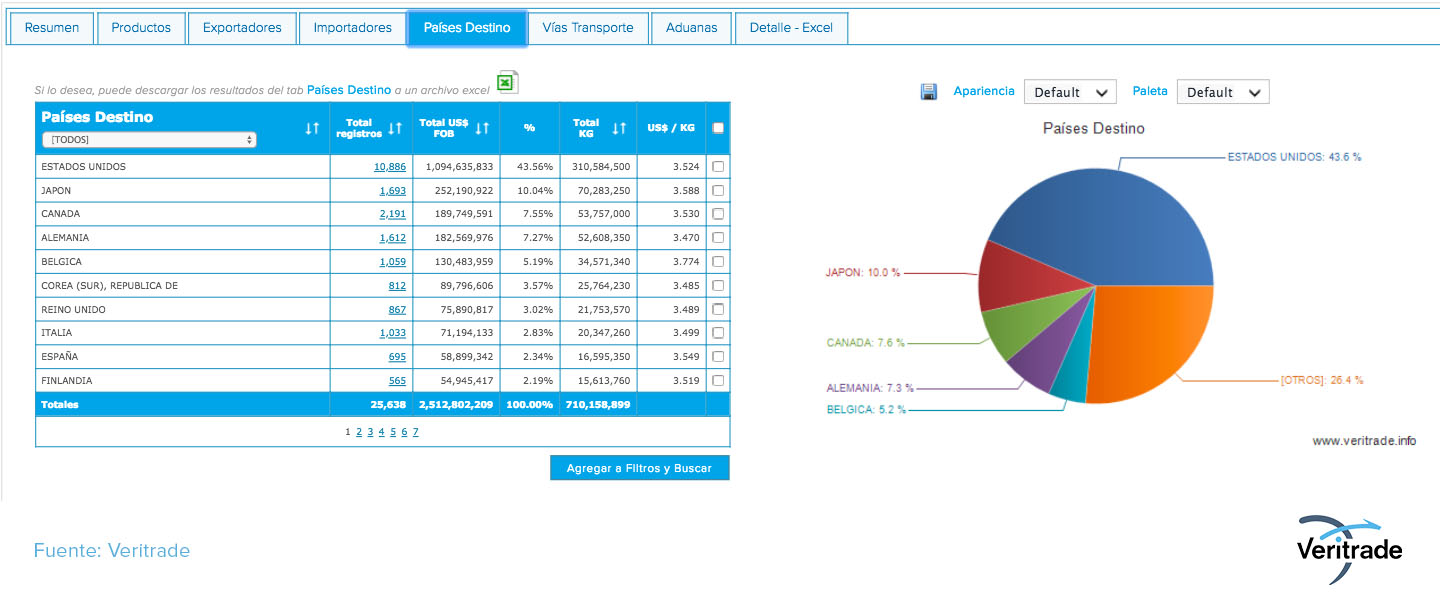
Now, let's imagine that the company is looking for a deeper detail of the destinations that Colombian coffee arrives at. With just one click on the Destination Countries tab, Veritrade will instantly generate a report on the countries that import Colombian coffee, and other details such as their share of the total, the weight of the merchandise shipped, and the average price paid per kilogram. Additionally, a circular chart with the details of the distribution according to participation will be shown, which can also be customized according to appearance and colors. The following image shows what will be shown on the screen:
In general, in the upper part of the summary table shown in the first graph of point 1., there are the tabs that give an option to select aspects that you want to analyze in greater detail. In this way, you can also obtain details of exporters, importers, transport routes, customs from which the merchandise exported or to which the imported merchandise arrived (in this case, the detail would correspond to the points of departure of coffee from Colombia ), and a detail in Excel of the information.
3. Exporting the information to an Excel spreadsheet
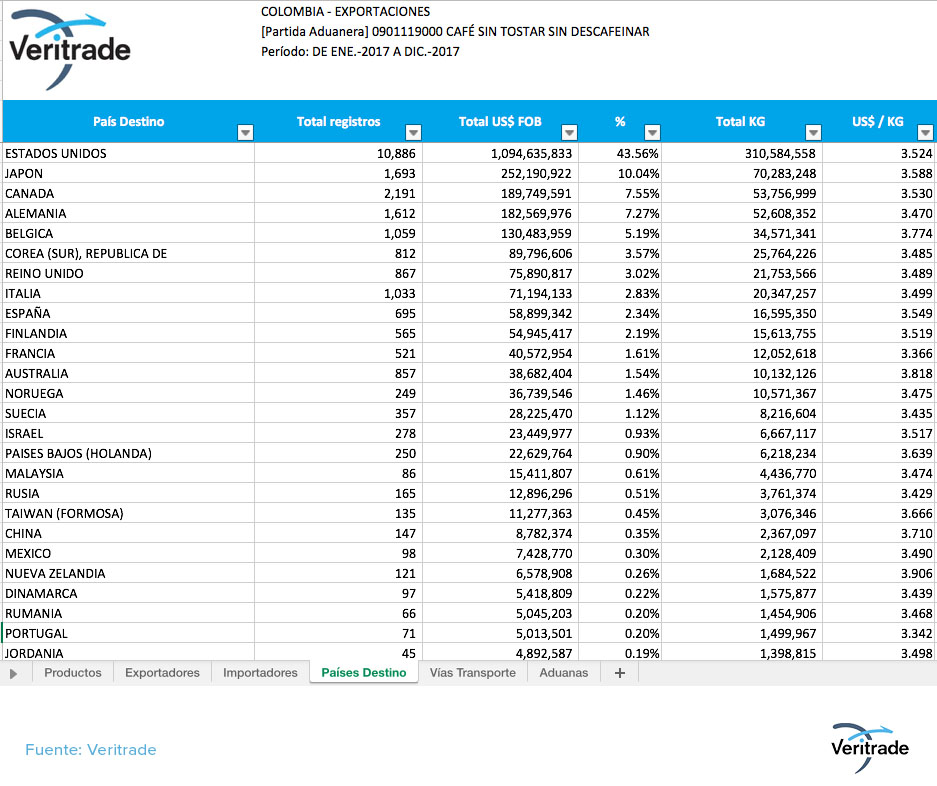
As just mentioned, all the data can be exported to Excel sheets. In general, the consolidation of all the information displayed can be downloaded by clicking on the icon of the Excel sheet shown on the screen when the Summary tab is selected, in which case a document will be obtained that will contain the data for all the categories corresponding to each of the tabs, as shown in the image. In this case, the Ecuadorian exporter may have the opportunity to process, according to their needs, the information coming from a consolidated base, without having to assemble a document by pasting information from each of the tabs with specific information. It is time to create an additional spreadsheet to do and undo, select, group, add, subtract or ponder according to what the analyst is looking for.
4. Generation of analysis by product or company
By clicking on the upper tabs My Products and My Companies, located at the top of the screen, you access the option to generate analytical reports by product or company.
Imagine now that it has been proposed to provide capital for a Chilean artisan wine producer of the Cabernet Sauvignon variety, and wants to take a quick look at the main market figures to corroborate the offer of its potential partner. When looking for results for shipments made between 2012 and 2017, the following information will be obtained:
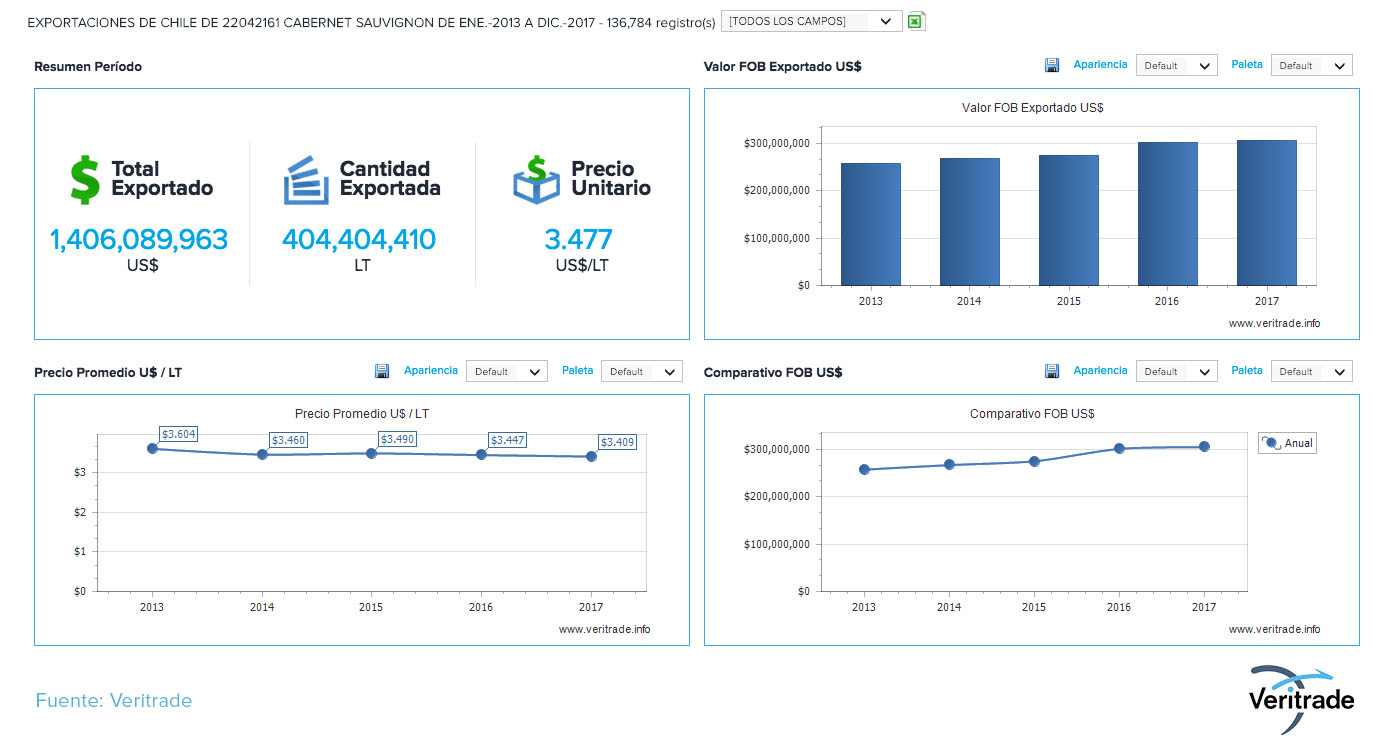
This is what you get with a single click. It is not necessary to spend a few minutes arranging data, naming series and preparing graphics. The exercise can be repeated for any exporting or importing company, and the information can also be downloaded in Excel, with the additional data of the ports of origin and destination.
Surprised? This is just a sample of what can be achieved. Explore Veritrade and live the experience of having all the commercial information at your fingertips.
Request your free trial at: https://bit.ly/2DN9k2a